import pandas as pd
import numpy as np

import matplotlib.pyplot as plt

# juste une commodité pour le notebook, pas important
import IPython
plot une dataframe
la dataframe des iris
→ digression: display d’une dataframe avec IPython
dans une cellule Jupyter on peut facilement afficher une dataframe, en finissant la cellule par le nom de la dataframe
mais comment faire si on veut afficher plusieurs dataframes dans la même cellule ?
l’approche naíve consisterait à utilsier un print(), mais le résultat est moche !
# vous pouvez essayer, le rendu n'est pas très lisible

by_sex = df.groupby(by='Sex')

for group, subdf in by_sex:
    print(group, subdf.head(1))
pour retrouver la même qualité d’affichage (en html)
il faut utiliser la méthode IPython.display.display()
en important la librairie IPython
# comme ceci ça devient lisible

import IPython

for group, subdf in by_sex:
    print(group)
    IPython.display.display(subdf.head(1))
# le code
df = pd.read_csv('data/iris.csv')
IPython.display.display( df.head(2) )
IPython.display.display( df.describe() )Loading...
Loading...
visualisation avec df.plot()
# le code
df.plot();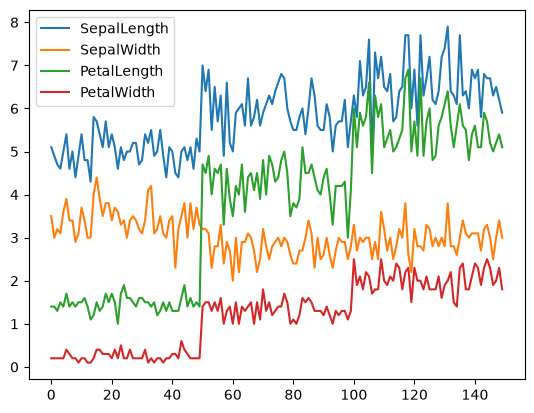
pourquoi c’est mieux qu’avec plt.plot() ?
plt.plot() ?voici ce qu’on obtient si on essaie de le faire “à la main” en matplotlib
d’une part c’est plus bavard, et d’autre part on n’a pas la légende...
plt.figure()
plt.plot(df.index, df.SepalLength)
plt.plot(df.index, df.SepalWidth)
plt.plot(df.index, df.PetalLength)
plt.plot(df.index, df.PetalWidth)
plt.show()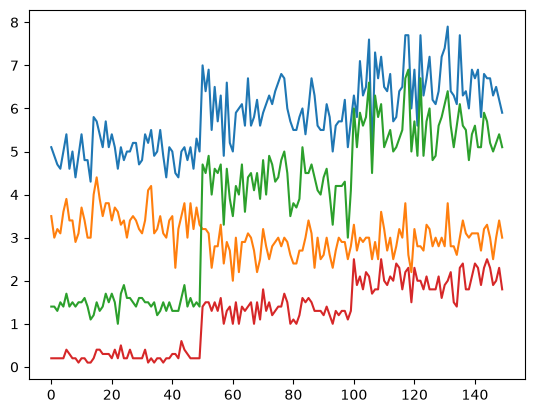
boxplots des colonnes df.boxplot
# le code

df.boxplot()

plt.show() # afin de ne pas superposer les plots

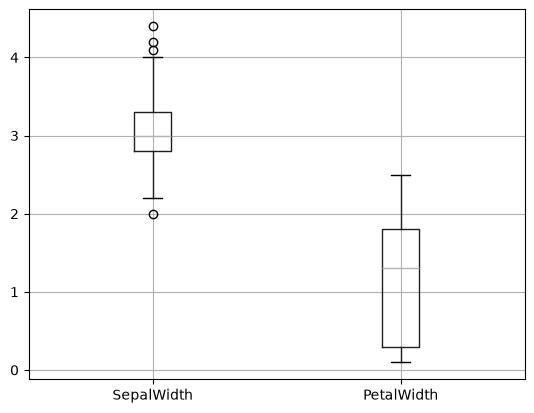
df.boxplot(['SepalWidth', 'PetalWidth']);

plt.show()

df.boxplot(['PetalLength'], by='Name')

plt.tight_layout() # le padding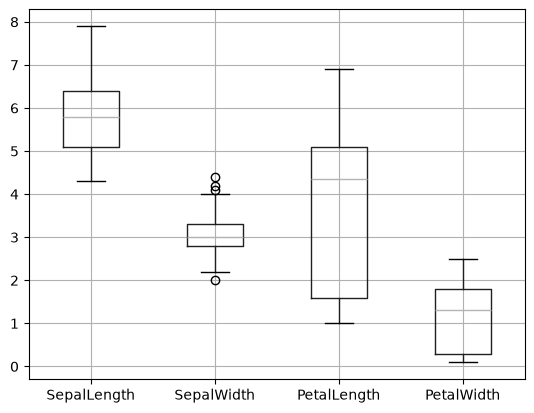
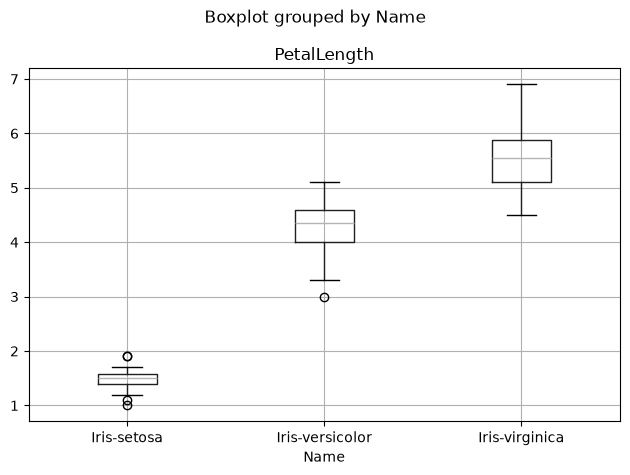
histogrammes df.hist()
# le code
df.hist()
df.hist('SepalLength', bins = 10, color='lightblue')
plt.title('histogramme de la colonne SepalLength');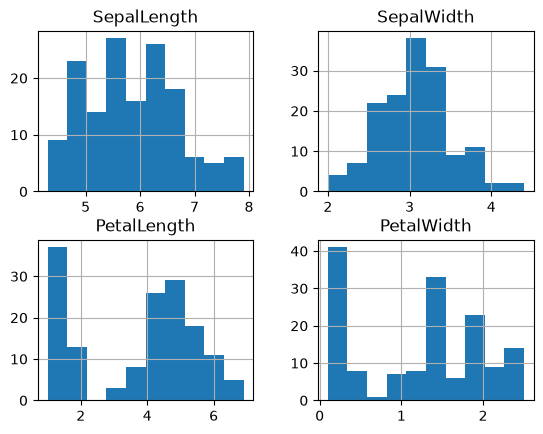
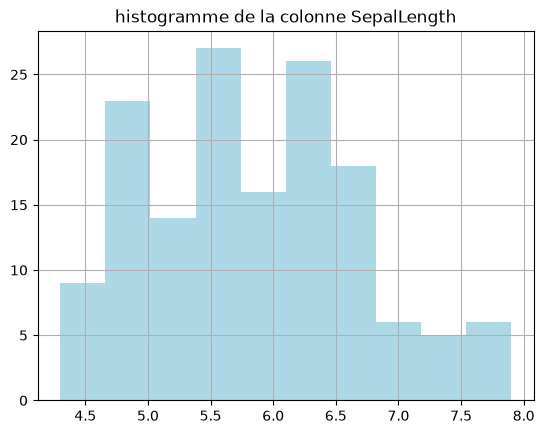
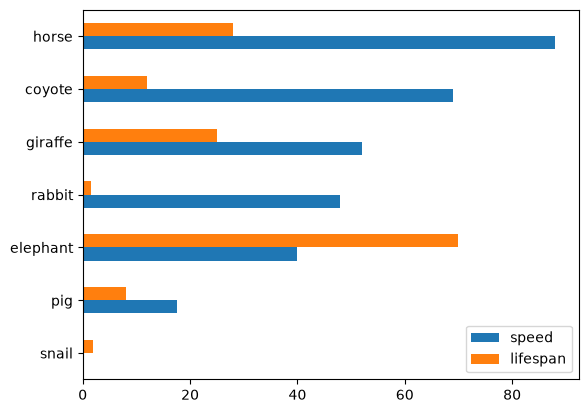
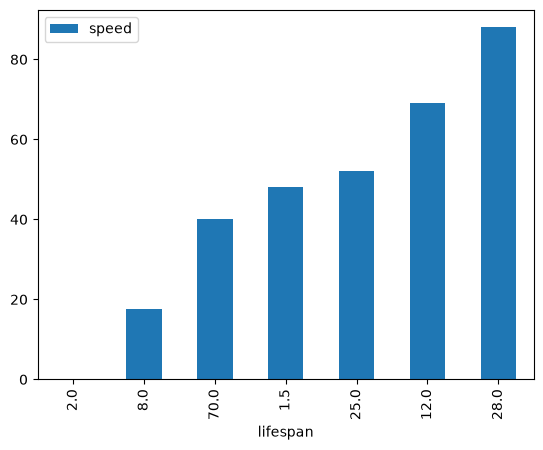
barchart df.plot.bar()
# le code
df_animals = pd.DataFrame({'speed' : [0.1, 17.5, 40, 48, 52, 69, 88],
                   'lifespan' : [2, 8, 70, 1.5, 25, 12, 28]},
                  index = ['snail', 'pig', 'elephant',
                           'rabbit', 'giraffe', 'coyote', 'horse'])

df_animals.plot.bar()

df_animals.plot.barh()

df_animals.plot.bar(x='lifespan', y='speed');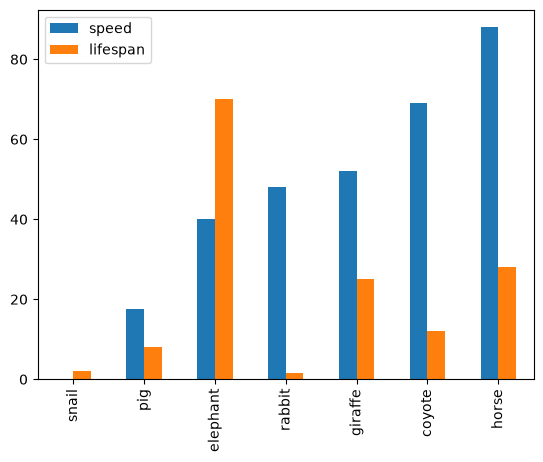
catégories
le type de la colonne 'Name'
# le code
IPython.display.display(   df[['Name']].describe()   )
df['Name'].value_counts()
Loading...
Name
Iris-setosa        50
Iris-versicolor    50
Iris-virginica     50
Name: count, dtype: int64
#le code
df['Name'].dtype<StringDtype(na_value=nan)>encodage de 'Name' en catégories
# le code
col = df['Name'].astype('category')
col.head(2)
0 Iris-setosa
1 Iris-setosa
Name: Name, dtype: category
Categories (3, str): ['Iris-setosa', 'Iris-versicolor', 'Iris-virginica']# le code
df['Name-code'] = col.cat.codes
df['Name-code'].value_counts()Name-code
0 50
1 50
2 50
Name: count, dtype: int64# et en une seul ligne
df['Name-code'] = df['Name'].astype('category').cat.codesnuages de points df.plot.scatter()
# le code
df.plot.scatter(x='SepalLength', y='SepalWidth');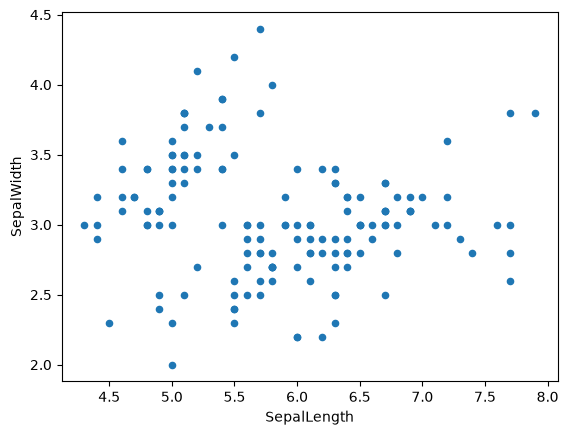
# le code
plt.scatter(df['SepalLength'], df['SepalWidth']);
# plt.xlabel('SepalLength')
# plt.ylabel('SepalWidth')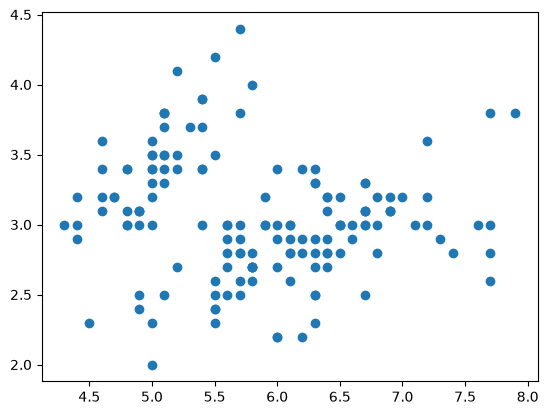
# le code
df.plot.scatter(x='SepalLength', y='SepalWidth', c='Name-code', cmap='viridis');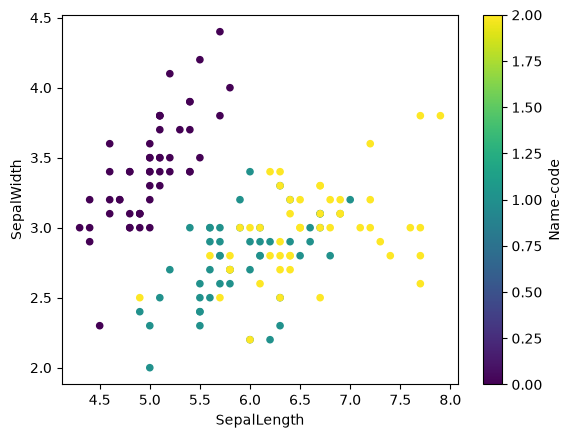
# le code
plt.scatter(df['SepalLength'], df['SepalWidth'], c=df['Name-code'], cmap='viridis')
plt.colorbar();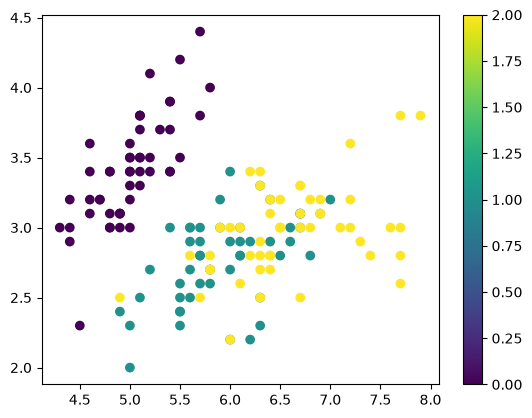
# le code
plt.scatter(df['SepalLength'], df['SepalWidth'], c=df['Name-code'], s=df['PetalWidth']*50);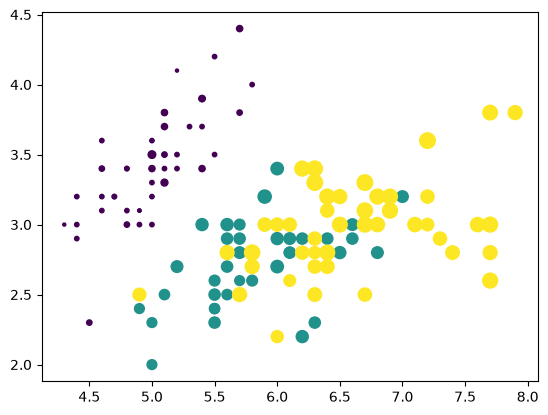
fabriquer son propre type category
# le code
iris_ord_cat = pd.CategoricalDtype(
    categories=['Iris-versicolor', 'Iris-virginica', 'Iris-setosa'],
    ordered=True
)
iris_ord_cat
CategoricalDtype(categories=['Iris-versicolor', 'Iris-virginica', 'Iris-setosa'], ordered=True, categories_dtype=str)df.Name = df.Name.astype(iris_ord_cat)df.sort_values(by='Name').head(4)Loading...